

🇺🇸米国株 S&P500のパフォーマンスを2つの加重方法から確認できるグラフです。
- 時価総額加重:時価総額の割合に合わせた組入比率でポートフォリオを組む方法
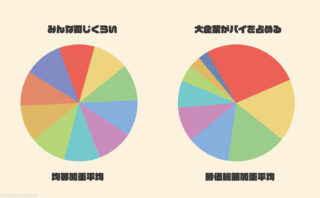
- 均等加重:すべての銘柄の組入比率を「1」としてポートフォリオを組む方法です。
時価総額加重では組入比率の大きい企業のパフォーマンスが株価に影響を与えやすいです。
均等加重では各銘柄の個別のパフォーマンスが株価に影響を与えます。時価総額は関係ないため、全体的な銘柄の堅調さなどを確認するのに役立ちます。
時価総額加重(ピンク)が均等加重(ブルー)より上にある場合は割高、下にある場合は割安の可能性があります。
S&P500:時価総額加重と均等加重のパフォーマンス対決(年初来)
S&P500:時価総額加重と均等加重の株価

A graph that shows the performance of the S&P 500 through two different weighting methods:
- Market Capitalization Weighting: A portfolio construction method that matches the inclusion ratio to the proportion of market capitalization.
- Equal Weighting: A method where the inclusion ratio for all stocks is set to ‘1,’ creating a portfolio.
In market capitalization weighting, the performance of companies with a large ratio of inclusion tends to have a greater impact on stock prices.
In equal weighting, the individual performance of each stock affects the stock price. Since market capitalization is irrelevant, it is useful for checking the overall sturdiness of stocks, among other things.
If the market capitalization weighting (pink) is above the equal weighting (blue), it may indicate that the stocks are overvalued. If it is below, it may indicate that the stocks are undervalued.
データ識別:●S&P500 Equal vs Capital Weight